These days, all organizations have systems in place that generate huge amounts of data. Businesses realize it is an important resource. Yet many are not able to use it to its full potential. As ubiquitous as data has become (more data has been created in just the last two years than in the entire previous history of the human race), so is the need for actionable data insights (Less than 1% of all data is ever analyzed).
Cashing in on the data dividend
With workplace well-being moving up on the management agenda, it is essential to know how your organization works and how to optimize the environment for that. That’s why FMs should not be afraid of data and analytics, but instead think of it as their best friend and ally. A friend that’s helping them provide the right support to the business, prove ROI, and get executive buy-in.
Actionable data comes in many forms and serves multiple purposes. Let’s look at some of the most relevant aspects for FMs:
Centralized data
In the world of facilities management, data is still often locked away in legacy systems and office tools. As a result, it’s fragmented, not easily searchable, and not used efficiently – or not used at all. Data siloes and a lack of traceability may lead to duplicate and conflicting data, flawed reporting, and inefficient processes. Siloes are very prevalent in facility management software, such as point solutions and traditional CAFM. But it doesn’t have to be that way. Truly integrated workplace management software (IoT-enabled IWMS) centralizes all data on a single platform, offering huge benefits in terms of data quality and business process integration. Imagine all the data about your buildings, their utilization, and associated costs at your fingertips.
Spatial data
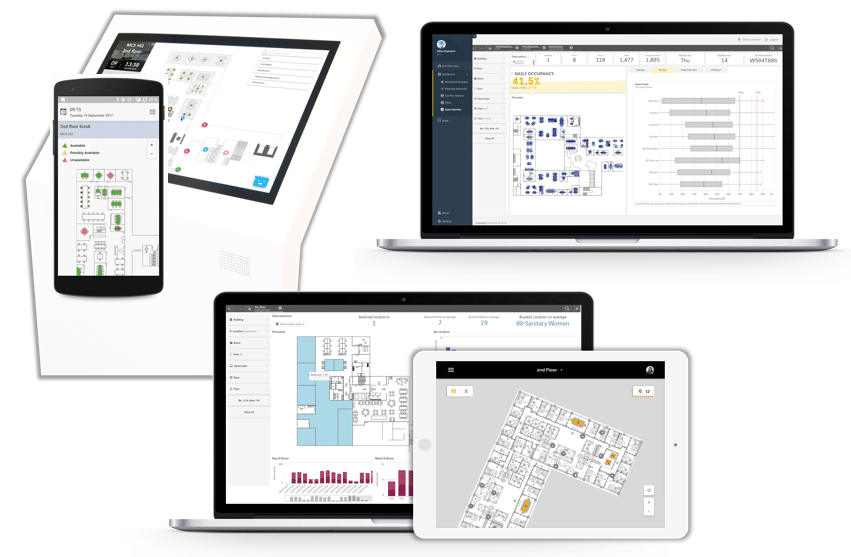
Good spatial data is fundamental. You cannot do without it for locations and reservations management, occupancy monitoring, asset tracking, and maintenance activities. The best IWMS software converts drawings into intelligent data so that changes in the database are automatically reflected on dynamic floor plans.
Benchmarking data
Comparing buildings is a great way to discover bad performers and start improvement initiatives. However, don’t compare apples and oranges. Use international space standards when benchmarking cross-border building portfolios. Also, normalize energy data for weather before evaluating energy efficiency.
Mobile data
FM teams have always been mobile, working around sites or buildings. Mobile apps allow them to access information when they need it and manage their workflows on the go. It also offers QR code scanning and improves the quality of data capture. Mobile apps not only benefit service operatives, however. With mobile and activity-based working becoming more and more common, FM software needs to offer that kind of flexibility to all workers and use the data to provide real-time assistance and better-targeted services.
Live utilization data
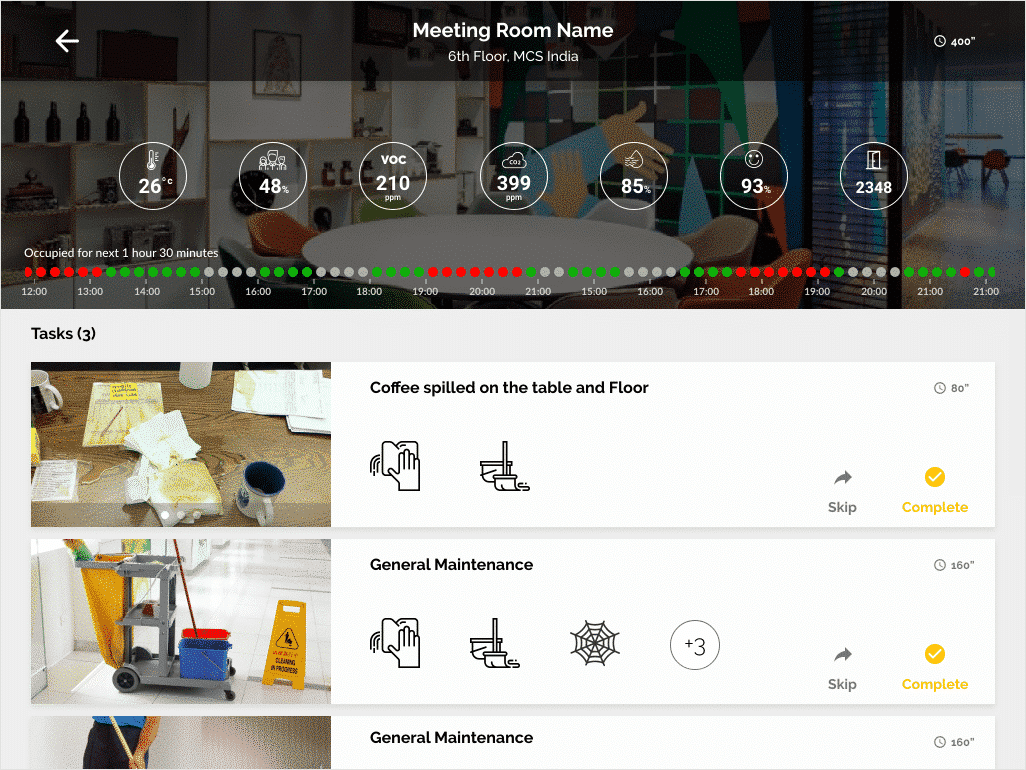
Businesses increasingly use the IoT in office buildings to capture data about the realities on the ground. Because they permanently measure parameters such as ambient conditions and space occupancy, connected sensors take away the guesswork. When integrated with operational FM software, the data from IoT devices allows to track assets in real-time, provide dynamic workplace guidance, fine-tune ambient conditions, and drive activity-based services.

Historical utilization data
When aggregated and visualized, all these data points show performance trends and anomalies, enabling facility managers to optimize space, energy, and service delivery. And to remove barriers to workplace productivity.
Actionable data insights
It’s essential for FM to move beyond a “system of record” where data is stored and then ignored because there is just too much of it and it’s not clear how to use it in a meaningful way. Think about business goals and scenarios first, and then collect the data you need to trigger actions in (almost) real time. Connect your analytics to action to enable preventive and predictive maintenance, a better workplace experience, and smarter services.

Data as decision support
Set KPI targets and use data visualization and dashboards to monitor performance indicators and to make sure you are on the right path. Good dashboards are like a cockpit, that changes with the landscape and moving goalposts. Listen to what the data is telling you, which may be different from what you anticipated. Don’t brush aside the findings even if you don’t like them (or they don’t prove the point you were hoping to make). And ask for input from data experts for the correct interpretation of the story the data is telling you.
Want to make your building data more actionable? Feel free to contact us to explore relevant scenarios or to request a free demo.


